grafana #
A data visualization platform. I use this to show statistics from my systems e.g. cpu temperatures,drive usage, space left on disk, etc. and now with loki also logs. All of these things are available from the Grafana dashboard.
Loki #
This is a tool by Grafana Labs to display and analyze logs from various sources. I mainly use it to look at docker container logs because I experiment whit them often.
Enable Loki logging for my install #
To send logs to loki with alloy add this to the compose file:
labels:
  loki: "true"
I don’t like all logs being saved for now so alloy only saves logs for container whit this label.
alloy #
Alloy is also made by Grafana Labs and acts as a data collector. It can collect logs, metrics and other data whit some custom code, or you can actively send it data to hand over to grafana or loki.
Prometheus #
Prometheus is used here because alloy collects metrics from docker with cAdvisor and sends them to a Prometheus install for storage.
telegraf #
A translation layer similar to alloy but from the influx data team, for me it was convenient to get metrics from TrueNAS to Influxdb. it might be possible to replace this application by alloy.
Influxdb #
A database for time series data great for things like metrics. for me it was convenient to collect and store metrics from multiple pc’s/servers. home assistant also saves its history here so i can track things ranging from my body weight to power usage of my entire home.
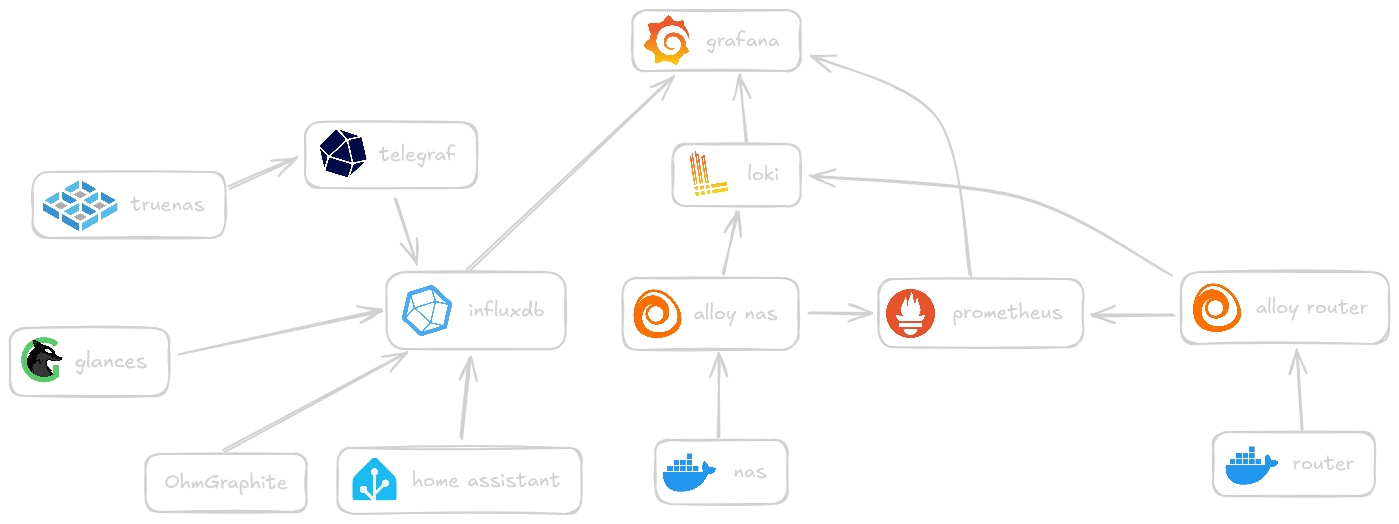
Topology #
monitoring data compose files #
The compose files running my grafana monitoring stack. also including telegraf ,influxdb and prometheus for some metrics from docker containers, my TrueNAS server and data from my home assistant server.
nas full grafana stack #
services:
  grafana:
    environment:
      - PATH=/usr/share/grafana/bin:/usr/local/sbin:/usr/local/bin:/usr/sbin:/usr/bin:/sbin:/bin
      - GF_PATHS_CONFIG=/etc/grafana/grafana.ini
      - GF_PATHS_DATA=/var/lib/grafana
      - GF_PATHS_HOME=/usr/share/grafana
      - GF_PATHS_LOGS=/var/log/grafana
      - GF_PATHS_PLUGINS=/var/lib/grafana/plugins
      - GF_PATHS_PROVISIONING=/etc/grafana/provisioning
      - GF_SECURITY_ALLOW_EMBEDDING=true
      - GF_AUTH_ANONYMOUS_ENABLED=true
    image: grafana/grafana-oss:latest
    restart: unless-stopped
    volumes:
      - /nfs/configs/grafana:/var/lib/grafana
    ports:
      - 10480:3000
    labels:
      traefik.enable: "true"
      traefik.http.routers.grafana80.entrypoints: web
      traefik.http.routers.grafana80.rule: Host(`graph.ianb.be`)
      traefik.http.routers.grafana80.tls: "false"
      traefik.http.routers.grafana80.middlewares: grafana-https
      traefik.http.middlewares.grafana-https.redirectscheme.scheme: https
      traefik.http.routers.grafana.entrypoints: websecure
      traefik.http.routers.grafana.rule: Host(`graph.ianb.be`)
      traefik.http.routers.grafana.tls: "true"
      traefik.http.routers.grafana.tls.certresolver: production
      traefik.http.services.all_grafana.loadbalancer.server.port: "10480"
  grafana-loki:
    command: -config.file=/mnt/config/loki-config.yaml
    image: grafana/loki:3.5
    ports:
      - 3100:3100
    volumes:
      - /nfs/configs/grafana-loki/loki:/mnt/config
    labels:
      traefik.enable: "true"
      traefik.http.routers.loki80.entrypoints: web
      traefik.http.routers.loki80.rule: Host(`loki.ian.lan`)
      traefik.http.routers.loki80.tls: "false"
      traefik.http.routers.loki80.middlewares: loki-https
      traefik.http.middlewares.loki-https.redirectscheme.scheme: https
      traefik.http.routers.loki.entrypoints: websecure
      traefik.http.routers.loki.rule: Host(`loki.ian.lan`)
      traefik.http.routers.loki.tls: "true"
      traefik.http.services.loki.loadbalancer.server.port: "3100"
    restart: unless-stopped
  influxdb:
    user: "1001"
    environment:
      - PATH=/usr/local/sbin:/usr/local/bin:/usr/sbin:/usr/bin:/sbin:/bin
      - GOSU_VER=1.12
      - INFLUXDB_VERSION=2.3.0
      - INFLUX_CLI_VERSION=2.3.0
      - INFLUX_CONFIGS_PATH=/etc/influxdb2/influx-configs
      - INFLUXD_INIT_PORT=9999
      - INFLUXD_INIT_PING_ATTEMPTS=600
      - DOCKER_INFLUXDB_INIT_CLI_CONFIG_NAME=default
    image: influxdb:2-alpine
    ports:
      - 8083:8083/tcp
      - 8086:8086/tcp
    restart: unless-stopped
    volumes:
      - /nfs/configs/influxdb/config:/etc/influxdb2
      - /nfs/configs/influxdb/data:/var/lib/influxdb2
    deploy:
      resources:
        limits:
          memory: 1G
    labels:
      traefik.enable: "true"
      traefik.http.routers.influxdb80.entrypoints: web
      traefik.http.routers.influxdb80.rule: Host(`influxdb.ian.lan`)
      traefik.http.routers.influxdb80.tls: "false"
      traefik.http.routers.influxdb80.middlewares: influxdb-https
      traefik.http.middlewares.influxdb-https.redirectscheme.scheme: https
      traefik.http.routers.influxdb.entrypoints: websecure
      traefik.http.routers.influxdb.rule: Host(`influxdb.ian.lan`)
      traefik.http.routers.influxdb.tls: "true"
      traefik.http.services.all_influxdb.loadbalancer.server.port: "8086"
  telegraf:
    image: telegraf:alpine
    ports:
      - 2003:2003/tcp
    restart: unless-stopped
    volumes:
      - /nfs/configs/telegraf/telegraf.conf:/etc/telegraf/telegraf.conf
  alloy:
    command: run --server.http.listen-addr=0.0.0.0:12345
      --storage.path=/var/lib/alloy/data /etc/alloy/config.alloy
    image: grafana/alloy:latest
    ports:
      - 12345:12345
    volumes:
      - /nfs/configs/grafana-loki/alloy/nas/config.alloy:/etc/alloy/config.alloy
      - /var/log:/var/log:ro
      - /var/run/docker.sock:/var/run/docker.sock
      - /:/rootfs:ro
      - /run:/run:ro
      - /var/lib/docker/:/var/lib/docker/:ro
      - /run/udev/data:/run/udev/data:ro
      - /sys:/sys:ro
    restart: unless-stopped
    deploy:
      resources:
        limits:
          memory: 4G
    labels:
      - loki=true
  prometheus:
    image: prom/prometheus
    command: --config.file=/etc/prometheus/prometheus.yaml
      --web.enable-remote-write-receiver
    ports:
      - 9090:9090
    volumes:
      - /nfs/configs/prometheus/config:/etc/prometheus
      - /nfs/configs/prometheus/data:/prometheus
    restart: unless-stopped
    labels:
      loki: "true"
networks: {}
router alloy only for data collection #
services:
  alloy:
    command: run --server.http.listen-addr=0.0.0.0:12345
      --storage.path=/var/lib/alloy/data /etc/alloy/config.alloy
    image: grafana/alloy:latest
    ports:
      - 12345:12345
    volumes:
      - /nfs/configs/grafana-loki/alloy/router/config.alloy:/etc/alloy/config.alloy
      - /var/log:/var/log
      - /var/run/docker.sock:/var/run/docker.sock
    deploy:
      resources:
        limits:
          memory: 1G
    restart: unless-stopped
networks: {}